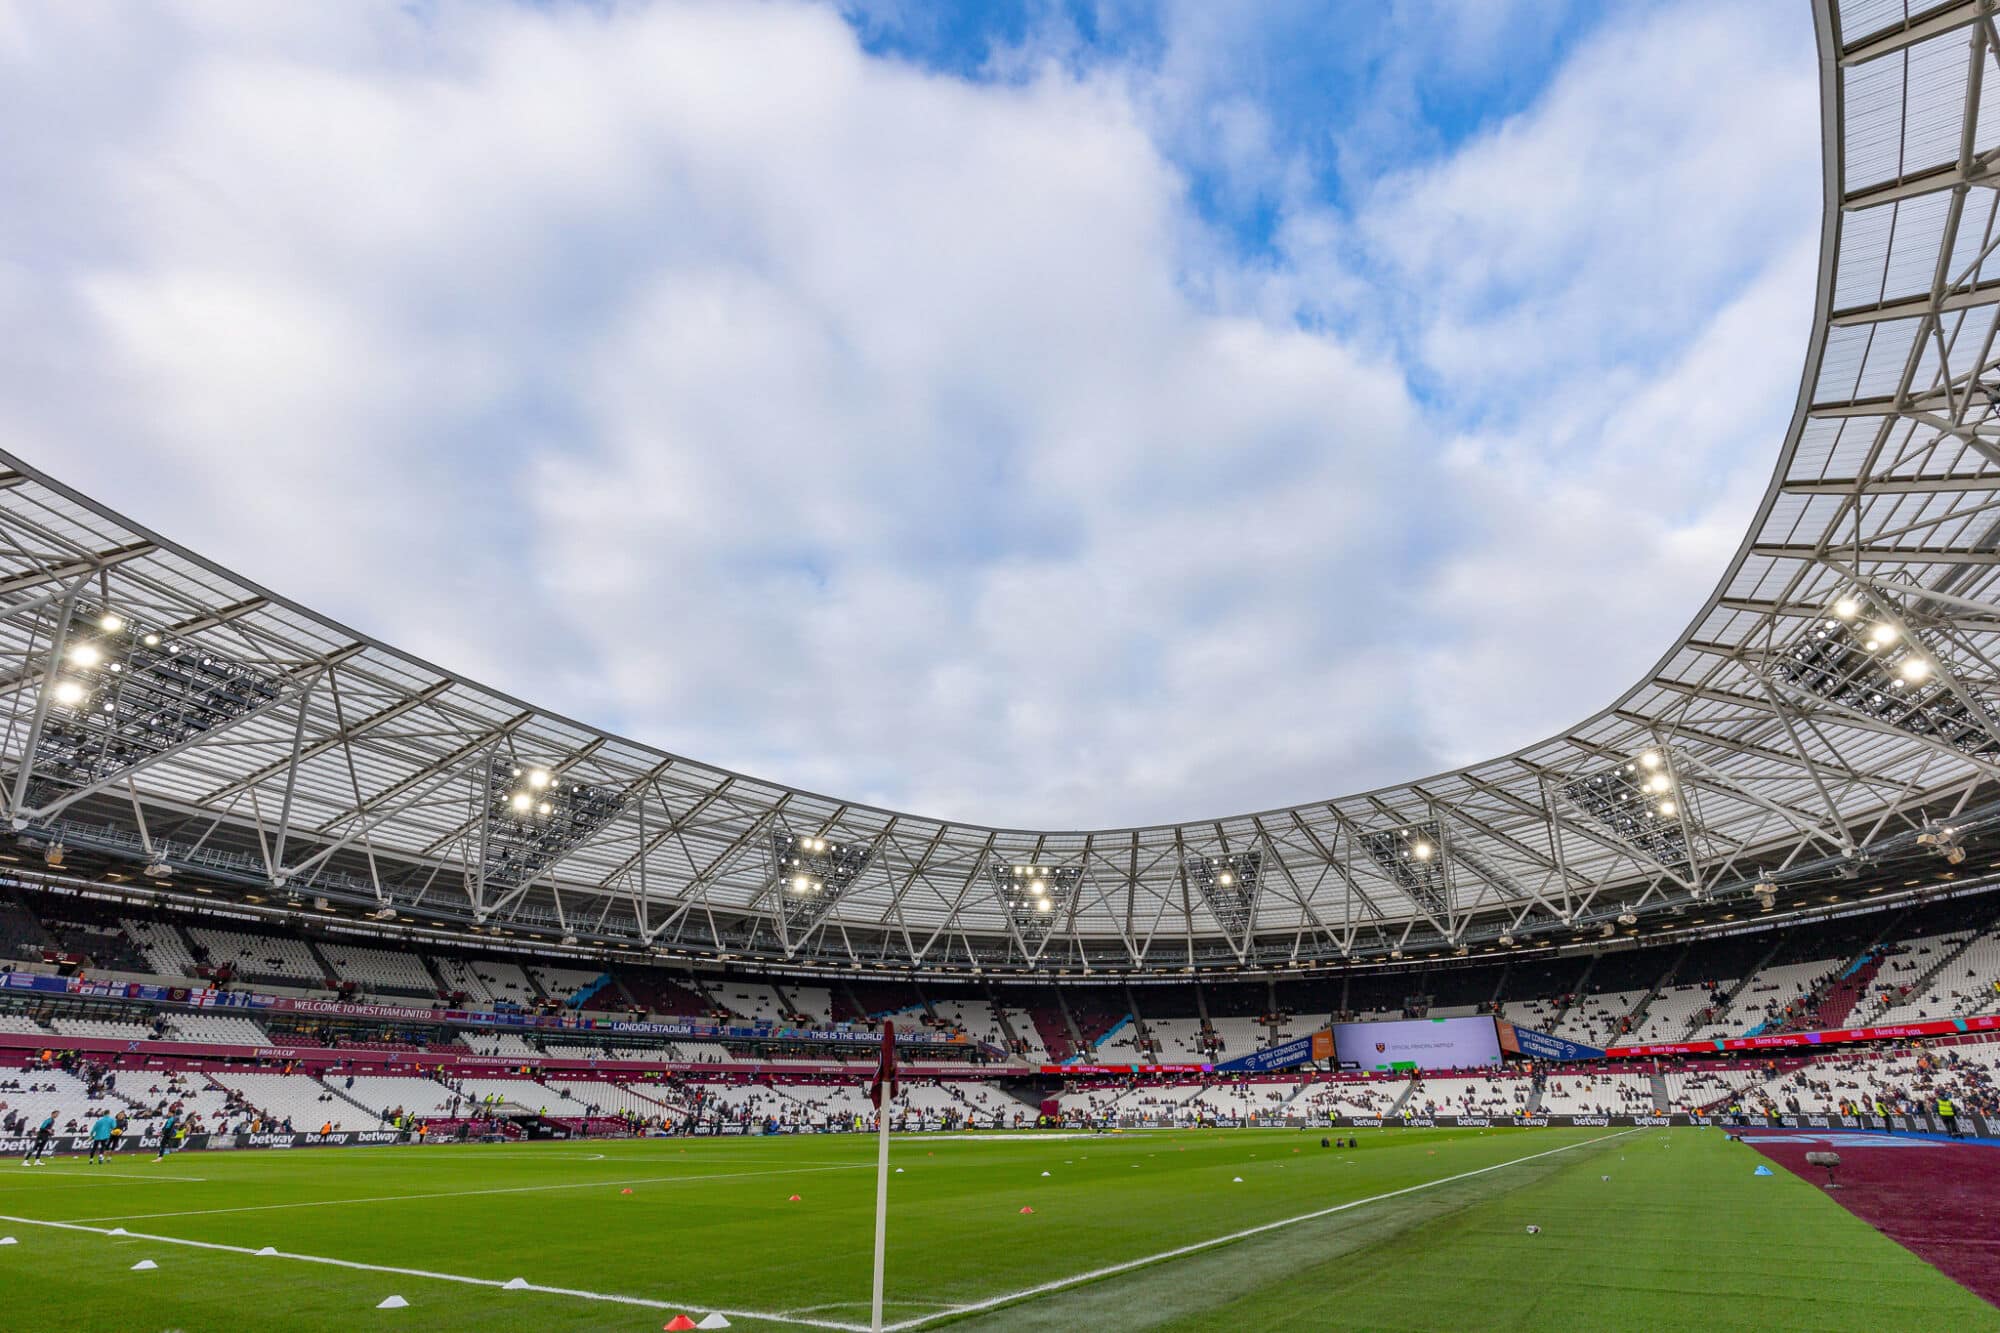
We are now 26 games into the 2025/26 Premier League season, and for the first time, the top six are starting to push away from the chasing pack behind.
At the very top of the table, Arsenal are leading the way with a four-point gap over Manchester City in second place. The Gunners were looking at a nine-point lead earlier this month, but City's two late goals at Anfield on Sunday reignited the title race and the pressure is firmly now on Mikel Arteta's side.
At the other end of the table, West Ham, Burnley and Wolves make up the bottom three. All hope is now lost for Wolves and Burnley, but the Hammers have found some form and have set up a thrilling end to the season at that end of the division.
How have the Premier League average attendances been shaping up so far, and are performances having an impact on turnout at PL stadiums? Let's take a look.

Average Premier League attendance 2025/26 – thru GW26
| Club | Stadium | Average attendances |
|---|---|---|
| Manchester United |
Old Trafford |
73,988 |
| West Ham |
London Stadium |
62,455 |
| Tottenham |
Tottenham Hotspur Stadium |
60,989 |
| Liverpool |
Anfield |
60,393 |
| Arsenal |
Emirates Stadium |
60,191 |
| Man City |
Etihad Stadium |
52,391 |
| Everton |
Hill Dickinson Stadium |
52,198 |
| Newcastle United |
St James' Park |
52,135 |
| Sunderland |
Stadium of Light |
46,607 |
| Aston Villa |
Villa Park |
41,822 |
| Chelsea |
Stamford Bridge |
39,654 |
| Leeds United |
Elland Road |
36,728 |
| Brighton |
Amex Stadium |
31,428 |
| Nottingham Forest |
The City Ground |
30,487 |
| Wolves |
Molineux |
29,731 |
| Fulham |
Craven Cottage |
27,084 |
| Crystal Palace |
Selhurst Park |
25,033 |
| Burnley |
Turf Moor |
21,088 |
| Brentford |
Gtech Community Stadium |
17,090 |
| Bournemouth |
Vitality Stadium |
11,144 |
Percentage of capacity filled – Premier League attendances 2024/25
- Old Trafford (Manchester United) – 74,879 capacity, 73,815 average = 98.6%
- Tottenham Hotspur Stadium (Tottenham Hotspur) – 62,850 capacity, 61,127 average = 97.3%
- London Stadium (West Ham United) – 62,500 capacity, 62,407 average = 99.9%
- Anfield Stadium (Liverpool) – 61,276 capacity, 60,486 average = 98.7%
- Emirates Stadium (Arsenal) – 60,704 capacity, 60,252 average = 99.3%
- Etihad Stadium (Manchester City) – 55,097 capacity, 53,636 average = 97.4%
- St James' Park (Newcastle United) – 52,258 capacity, 52,187 average = 99.9%
- Villa Park (Aston Villa) – 42,918 capacity, 41,772 average = 97.3%
- Stamford Bridge (Chelsea) – 40,853 capacity, 40,682 average = 96.1%
- Goodison Park (Everton) – 39,414 capacity, 39,191 average = 99.4%
- St. Mary's Stadium (Southampton) – 32,384 capacity, 30,865 average = 95.3%
- King Power Stadium (Leicester City) – 32,259 capacity, 31,448 average = 97.5%
- Molineux Stadium (Wolverhampton Wanderers) – 32,050 capacity, 31,484 average = 96.8%
- AMEX Stadium (Brighton Hove & Albion) – 31,876 capacity, 31,481 average = 98.8%
- The City Ground (Nottingham Forest) – 30,404 capacity, 30,076 average = 98.9%
- Portman Road (Ipswich Town) – 30,056 capacity, 29,742 average = 99.0%
- Craven Cottage (Fulham) – 29,589 capacity, 26,826 average = 90.7%
- Selhurst Park (Crystal Palace) – 25,486 capacity, 25,116 average = 98.6%
- Gtech Community Stadium (Brentford) – 17,250 capacity, 17,185 average = 99.6%
- Vitality Stadium (Bournemouth) – 11,307 capacity, 11, 200 average = 99.1%
